Building a Bespoke GUI for DSP Research with LLMs — Lessons from 1 Year of Daily Use
After a year of daily LLM use for DSP and algorithms research, u/diydsp from r/ClaudeAI shares a practical workflow centered around an ongoing GUI — a bespoke app built incrementally with LLM assistance. The key insight: rather than wasting time on GUI programming from scratch, let the LLM do the heavy lifting and add features as you need them.
Core Workflow Components
- Maintain a
problem_description.mdfile to keep the LLM focused on the research context. - Write 2-5 reports per day in both
.mdand.pdfformats — include executive summaries and plot interpretation descriptions. - Human → LLM Coding App → Human → LLM Chat App Loop — alternate between coding tasks and chat for iterative refinement.
- Don't let the LLM be dramatic — keep prompts concise and grounded to maintain sanity during long sessions.
- Share reports with coworkers regularly to avoid silos.
Developing an Ongoing GUI
Start by asking your LLM to create a simple GUI that browses data folders and makes generic plots. Then, each time you need a specific visualization (spectrogram, FFT, theta-domain conversion), add a tab with the prompt: "Please add a tab to my GUI that does it."
Plotting Best Practices
- Sync all X and Y axes across plots.
- Start all plots zoomed to fill 85% of vertical space.
- Make plots with similar units share the same range.
- When you need a variant of an existing analysis, prompt: "Remember that plot we added to the 'MCAP Analyzer' tab that performs the full analysis? Please make a second button below it named 'Extract' that only extracts the load cell values."
Adding Export Capabilities
Ask the LLM to write key values from plots into a .csv or .json file, or generate a textual description of each analysis step. This makes it easy to paste results into other software.
Tech Stack Recommendation
The author recommends Python with VisPy and Tkinter for cross-platform GPU-accelerated plotting. Matplotlib is an alternative (slower but with better zoom tools). If you're unfamiliar, just paste the recommendation into your LLM — it will handle the implementation.
Open Questions for the Community
- How to share LLM-coded programs with team members without endless code reviews?
- How to use databases on large shared drives (specifically CIFS NAS, which is terrible for DBs)?
- How to get LLMs to think out of the box — the author has spent days reinventing the wheel when the LLM could have suggested known approaches.
- What other tools to connect to the main LLM coding app to multiply its power?
The author also recorded a 27-minute talk covering 7 more sections. Full video at the source link.
📖 Read the full source: r/ClaudeAI
👀 See Also
Claude AI Used to Set Up Proxmox Home Server via SSH
A developer used Claude AI over SSH to configure a Proxmox VE 9.1 home server, performing tasks from drive formatting and ZFS pool creation to Docker deployment and security hardening.

Solo Founder Builds News Analysis Platform with Claude Code: Lessons on Scaling and Debugging
A solo founder without a CS degree built The Daily Martian, a news analysis platform analyzing 40+ outlets using Python/FastAPI, PostgreSQL, Redis, and React/TypeScript, primarily through Claude Code. The developer shares specific challenges including context loss, database connection issues, and debugging strategies.
iOS App Built Entirely with Claude Code by Non-Engineer Ships to App Store
A product manager with no iOS development experience shipped SpectraSort, a photo sorting app built entirely with Claude Code. The app uses on-device AI for quality ranking and personal taste learning, processing about 10 photos/second on the Neural Engine.
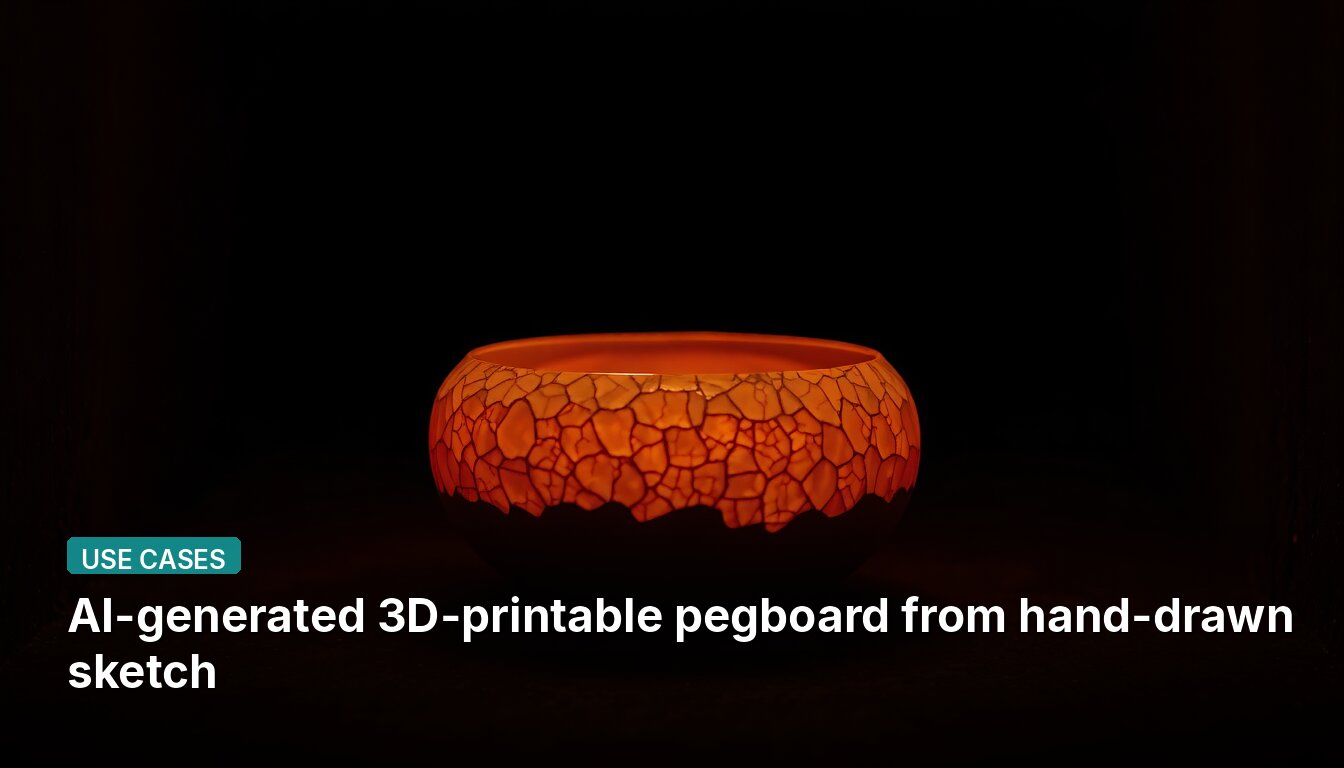
AI-generated 3D-printable pegboard from hand-drawn sketch
A developer used Codex to convert a hand-drawn sketch into parametric 3D models for a pegboard toy, specifying only two dimensions: 40mm hole spacing and 8mm peg width. The repository contains Python generators for seven play pieces, four gears, and printable boards.